Debug ISO 15118
This how-to-guide will show you how to debug ISO15118 communication of EVerest using Wireshark.
Wireshark plugin
Using the Wireshark plugin from dspace, it is possilbe to decode the EXI messages sent over the interface of the PLC modem. The plugin uses the same EXI decoder as EVerest.
It does even decrypt TLS-encrypted communication as EVerest sends the keys to decrypt the packages as UDP broadcast, so the plugin can make use of it. It is possilbe to live-view traffic between EV and EVSE and to decrypt captured traffic after the fact.
Install
Follow the steps in this README to install the plugin:
Tip
Make sure to copy the whole content of the zipped archive to the corresponding folder!
Remote live capture
In order to view live traffic, an ssh connection between the system(s) running Wireshark and the target is required.
Making use of a VPN connection enables remote live capture from around the globe, e.g. developers in the backoffice observing live traffic on chargers during testivals.
To start a remote live capture session in Wireshark, click on the small gear symbol next to:
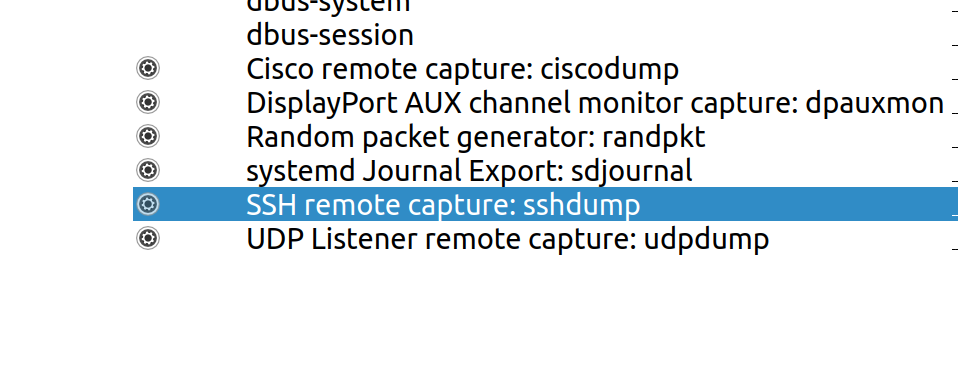
This should open a setup window. Enter the target IP address and SSH port.
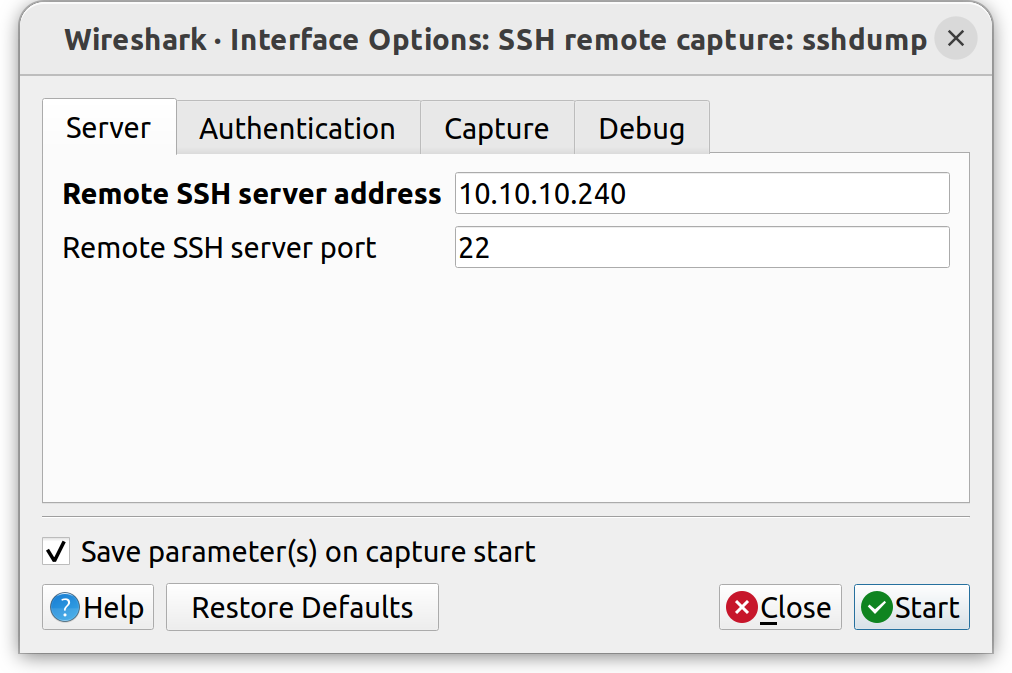
Select Authentication and enter the SSH credentials for the target.

Next, select Capture and type in the network interface on the target
that is used by the PLC modem. In the case of the YAK board, it is
eth1.

To start the live capture session, click on Start.
Tip
It is recommended to establish a passwordless SSH connection, as the password must be typed in every time a remote capture session is started. After setting this up e.g. via ssh-copy-id, select the path to your private key.
SSH credentials with an empty password are not supported for the steps above. However, in order to start a live capture session without any prior GUI setup using an empty or passwordless SSH connection, simply execute:
wireshark -k -i <( ssh <user>@<target_ip> tcpdump -s 0 -U -n -w - -i <device to listen on>)
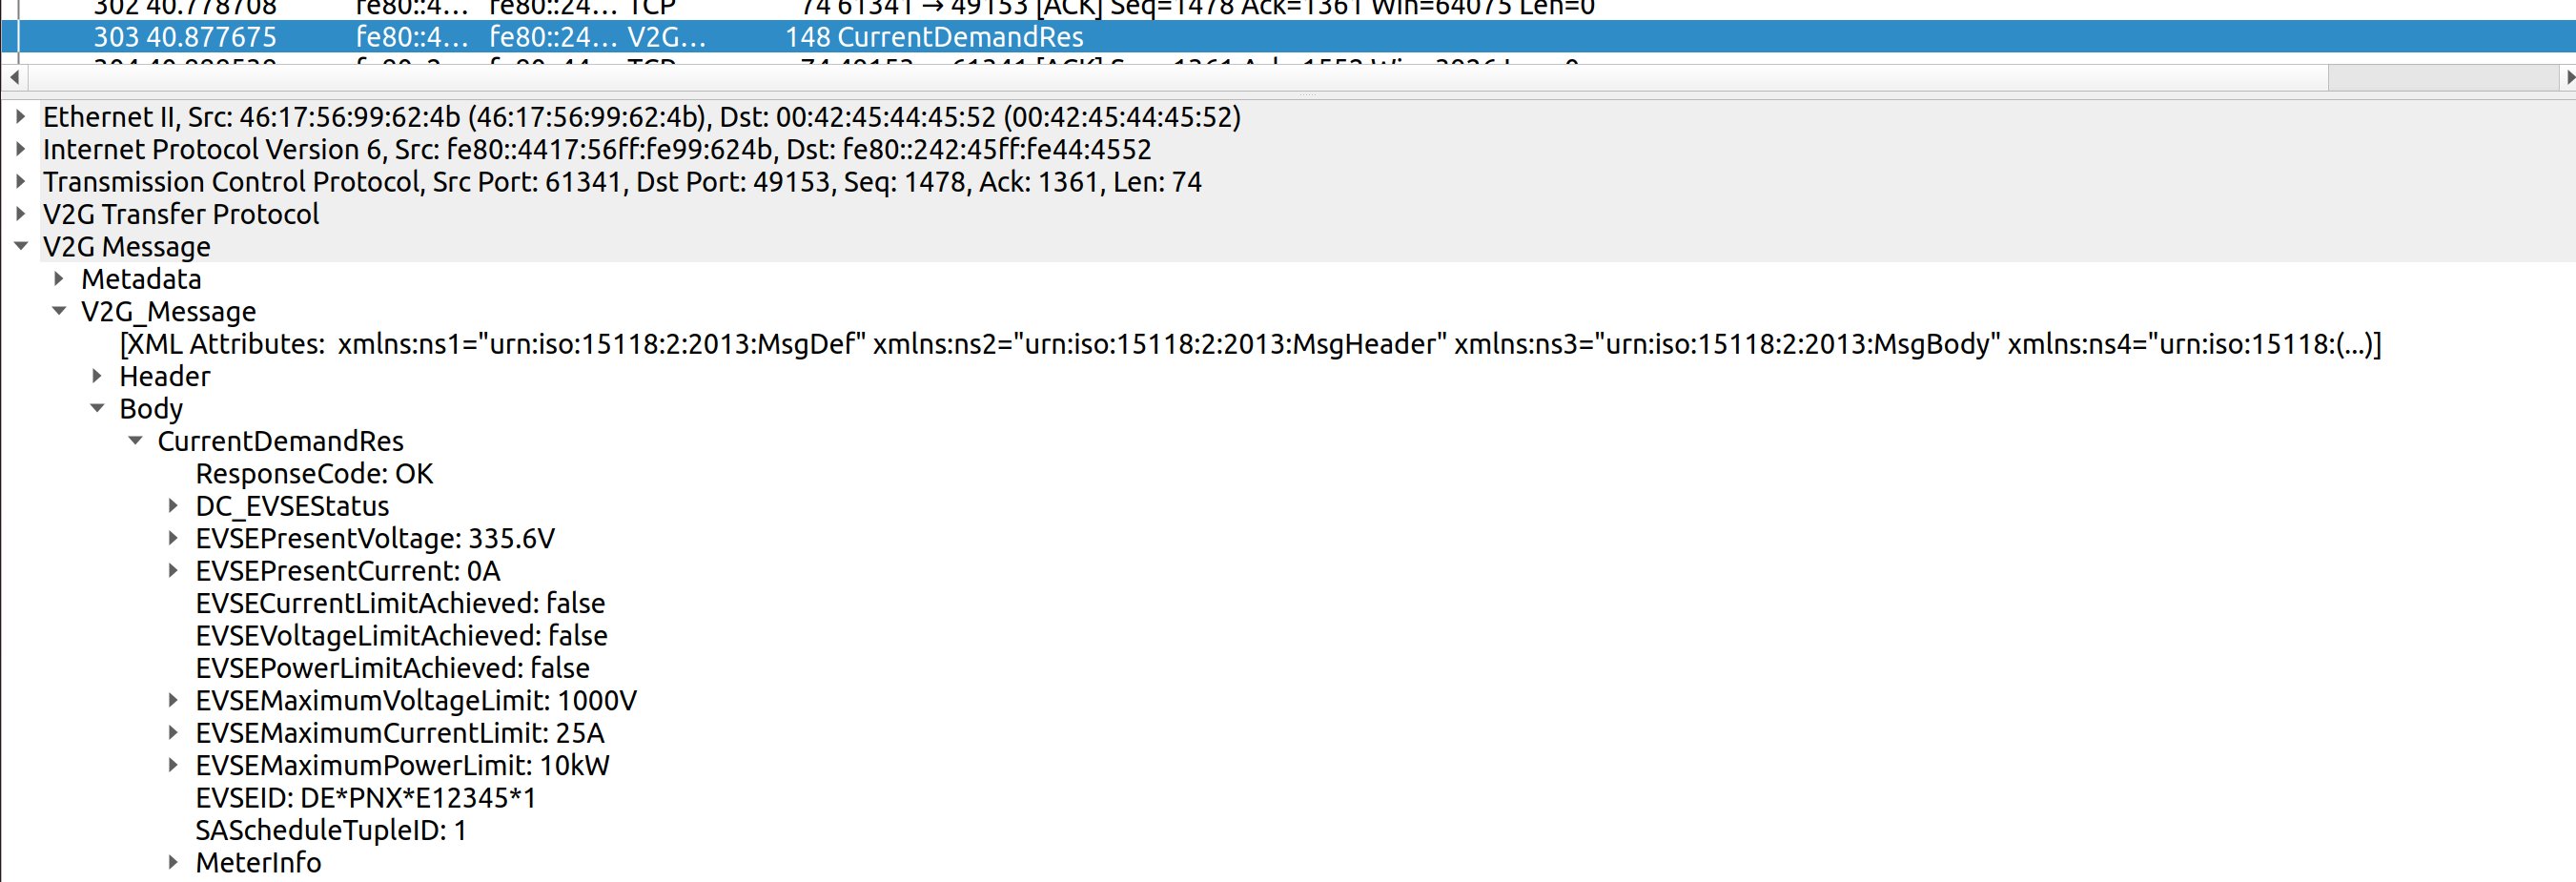
The remote live session should look like this:
Decoding captured traffic after the fact
To activate the local capturing of traffic between EV and EVSE, you need
to include the PacketSniffer module in your EVerest config:
packet_sniffer:
  config_module:
      session_logging_path: <your desired path>
  connections:
    evse_manager:
    - implementation_id: evse
      module_id: evse_manager
  module: PacketSniffer
In case you want to keep the capture files after a reboot, you need to
set the logging path, e.g. /var/everest-logs/sessions; otherwise
the default logging path is tmp, which will be empty on each boot.
To view the captured traffic, you can either download the .dump
files via SCP and use the Wireshark GUI to open the files or in case a
passwordless ssh is set up (ssh-copy-id), you can directly open
the file using:
wireshark -k -i <(ssh <user>@<target ip> cat <logging path on target>/ethernet-traffic.dump)
You can now view the decoded messages, e.g.
Authors: Cornelius Claussen